Agentic Chat
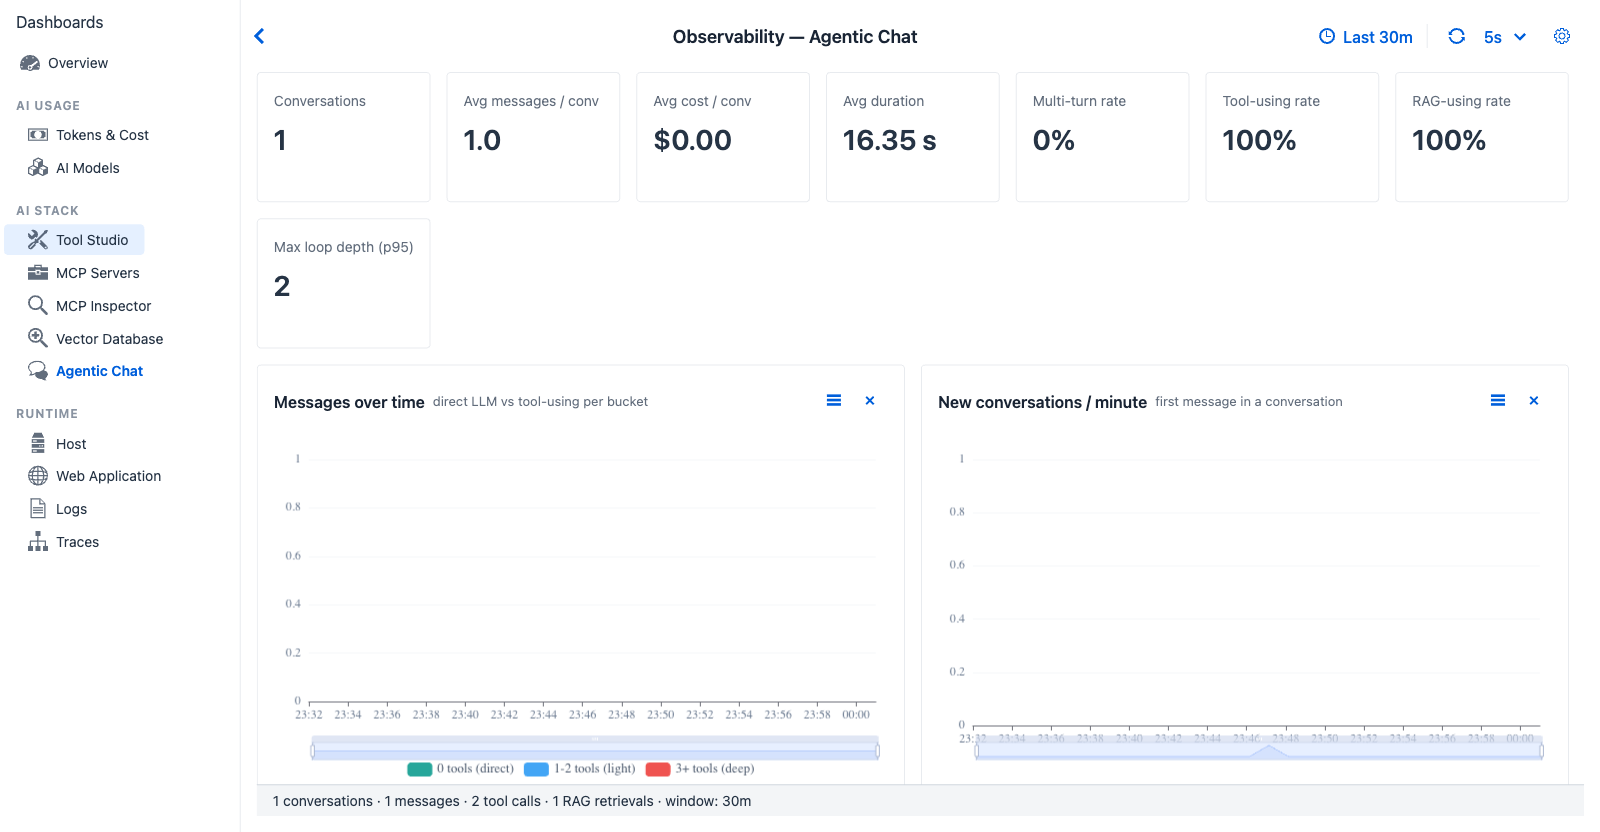
Agentic Chat - ConversationAggregator groups TraceRecords by conversationId to surface behavioural metrics that only make sense across multiple turns. Multi-turn rate identifies whether the window's traffic is a sustained session or a series of one-shot questions.
Purpose - conversation-level observability. The trace stream produces one TraceRecord per turn; this tab groups those by conversationId (via ConversationAggregator) and surfaces behavioural metrics that only make sense across multiple turns - multi-turn rate, loop depth, total cost per session.
When to look here
- "Are users running long, multi-turn sessions or one-shot questions?" - Multi-turn rate KPI + Conversation duration chart.
- "Is the agent looping?" - Max loop depth (p95) KPI + Agentic loop depth chart. A loop depth above 5 in steady-state is usually a misconfigured agent.
- "Which conversations cost the most?" - Cost per conversation chart + the conversations grid (sortable).
- "Are agents actually invoking tools end-to-end?" - Tool-using rate KPI.
- "Are conversations completing or timing out?" - Conversation outcomes chart.
- "Which models dominate inside conversations (vs per-turn)?" - Models used in conversations.
Source
ConversationAggregator walks ObservabilityRingBuffer.snapshot() and groups by conversationId. Computes per-conversation totals (token sums, cost via ModelPricingService, tool call counts, RAG flags, distinct models / providers, error counts, loop depth, duration).
Controls
All dashboards share the Observability global settings - time window, refresh interval, custom range. Agentic Chat has no tab-specific controls beyond those.
KPI cards (eight)
| Card | Shows | Source |
|---|---|---|
| Conversations | Number of distinct conversation IDs in the window | ConversationAggregator group count |
| Avg messages / conv | Mean message count per conversation | Aggregated |
| Avg cost / conv | Mean cost per conversation in active currency | Aggregated (uses ModelPricingService + CurrencyService) |
| Avg duration | Mean wall-clock duration from first to last turn | First-turn timestamp to last-turn timestamp |
| Multi-turn rate | Percentage of conversations with more than one user message | Boolean per conversation |
| Tool-using rate | Percentage of conversations that called at least one tool | Boolean per conversation |
| RAG-using rate | Percentage of conversations that triggered a vector query | Boolean per conversation |
| Max loop depth (p95) | 95th percentile of tools / messages ratio across conversations |
Heuristic for agentic looping |
Charts (eight)
| Chart | Type | Reading |
|---|---|---|
| Messages over time | Line, total messages per bucket | High slope → busy chat workload |
| New conversations / minute | Line | Spike = wave of new sessions; flat = warm steady state |
| Agentic loop depth | Histogram of per-conversation loop depth | Tail with depth >5 → agent loops |
| Conversation duration | Histogram (seconds) | Short vs long-session split |
| Tools used in conversations | Horizontal bar of distinct tools across conversations | Conversation-level tool palette |
| Models used in conversations | Horizontal bar | Should match the configured model unless the agent is provider-switching |
| Cost per conversation | Histogram, active currency | Long-tail upper bin = expensive conversations |
| Conversation outcomes | Stacked bar (Completed / Errored / Cancelled) | If Errored climbs, something is wrong end-to-end |
Tables
Conversations grid - First · Conv id (short) · Messages · Duration · ... - click a row to open the Conversation Thread dialog (documented alongside Trace Detail on the Traces page).
Cross-references
- Agentic Chat (feature) - the chat UI that produces these traces
- Traces - raw per-turn view; Agentic Chat is the aggregated view
- Observability Architecture → Conversation-level views -
ConversationAggregatorandConversationMessageExtractordesign