MCP Servers
MCP Servers - Servers up 1 / 1 and OAuth authorized 1 reflect the built-in spring-ai-playground-built-in-mcp server registered over streamable-http. Tool-call volume bars surface as soon as an external MCP catalog entry is activated and the agent reaches a tool through it.
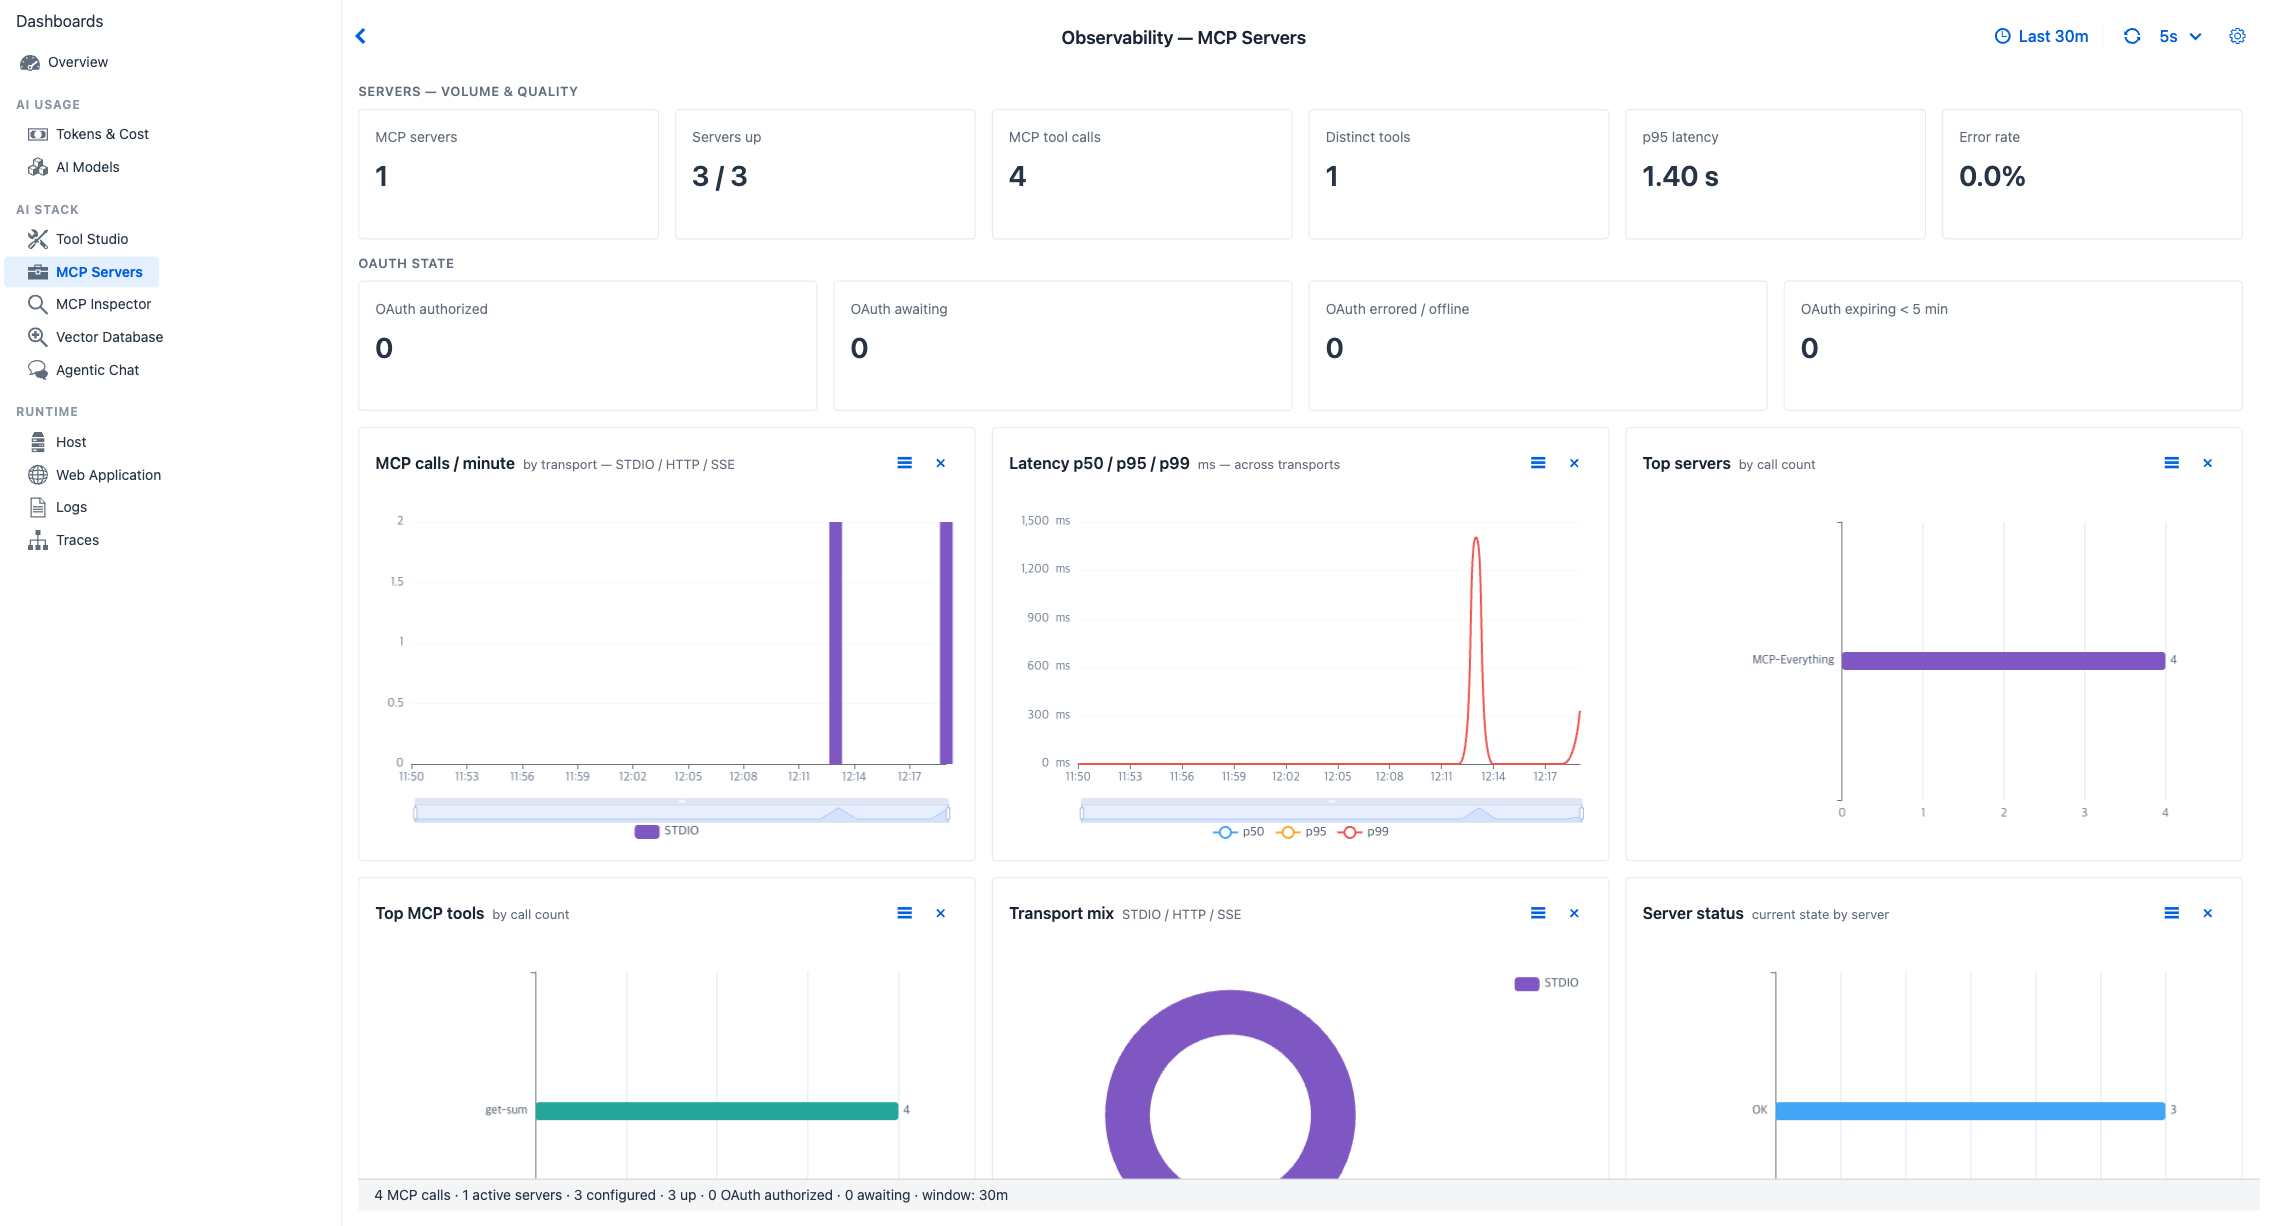
Purpose - external MCP server health and traffic. Latency by transport, OAuth state across servers, lifecycle events.
When to look here
- "Is one MCP server slow?" - Latency p50 / p95 / p99 stacked by transport; Top servers identifies which one carries the most traffic.
- "Did an OAuth token expire silently?" - OAuth expiring <5 min KPI + the OAuth status grid below.
- "Is the agent reaching a server that crashed?" - Servers up vs MCP servers KPI gap (e.g.
3 / 5is two servers down). - "Which transport family dominates?" - Transport mix donut (stdio / streamable-http / sse).
- "Did the lifecycle behave abnormally?" - Lifecycle events by transport class chart (initialize / shutdown / etc.).
Span filter
spring.ai.tool spans where mcp.method.name is present.
Each such span is enriched by McpToolObservationFilter with risk and composition dimensions lifted from the call's MDC context: saip.tool.origin (internal_js / wrapped_external), saip.composition.id / .name, saip.tool.exposed_alias, saip.mcp.server (the upstream server name), the three risk levels saip.risk.final / .server / .publish, and saip.risk.floor_trigger when a floor rule tripped. So a tool re-exposed through composition is traceable back to its upstream server and its computed risk - not just its exposed alias.
Controls
All dashboards share the Observability global settings - time window, refresh interval, custom range. MCP Servers has no tab-specific controls beyond those.
KPI cards - Volume & Quality (six)
| Card | Shows | Source |
|---|---|---|
| MCP servers | Number of registered external MCP servers | McpClientService.registeredServers().size() |
| Servers up | Number with last connection state OK | Live ping / connection state |
| MCP tool calls | Count of all externally-routed tool calls | Spans with mcp.method.name non-null |
| Distinct tools | Unique tool names called externally | set(spring.ai.tool.definition.name) filtered |
| p95 latency | 95th-percentile external tool duration | Span duration distribution |
| Error rate | Percentage of external calls with status=ERROR |
Span status |
KPI cards - OAuth State (four)
| Card | Shows | Source |
|---|---|---|
| OAuth authorized | Count of OAuth-protected servers currently in authorized state | McpServerInfo.oauthStatus |
| OAuth awaiting | Count awaiting authorization (user-driven OAuth dance not yet completed) | OAuth state machine |
| OAuth errored / offline | Count where OAuth flow has errored or the server is unreachable | OAuth state machine + ping |
| OAuth expiring < 5 min | Token-refresh urgency - these will fail soon if not refreshed | Token expiry timestamp |
Charts (seven)
| Chart | Type | Reading |
|---|---|---|
| MCP calls / minute | Line per transport, stacked | Drop to zero on one transport → that transport class lost connectivity |
| Latency p50 / p95 / p99 | Multi-line, ms (one per transport) | stdio is consistently faster (no network); HTTP variants show round-trip cost |
| Top servers | Horizontal bar, by call count | Identifies the server carrying the most traffic |
| Top MCP tools | Horizontal bar, by call count | Same question scoped to specific tool names across servers |
| Transport mix | Donut (stdio / streamable-http / sse) | Sanity check against expected routing |
| Server status | Stacked bar over time (OK / Error / Awaiting) | Spot a server flipping in/out of healthy state |
| Lifecycle events by transport class | Bar | Unusual shutdown cluster → server crash loop |
Tables
OAuth status grid - Server · Transport · Status · ... - sorted by Status; expiring tokens highlighted. Click a row to navigate to the MCP Server connection page where you can re-authorize.
Cross-references
- MCP Server (feature) - how external MCP servers are registered + the Inspector built-in to Spring AI Playground
- MCP Inspector - sibling tab for MCP primitive operations (read tools, read resources, etc.) rather than tool execution
- Tool Studio - sibling tab for the same shape of data, locally executed
- Observability Architecture → Tool and MCP observability -
mcp.method.namediscriminator