Overview
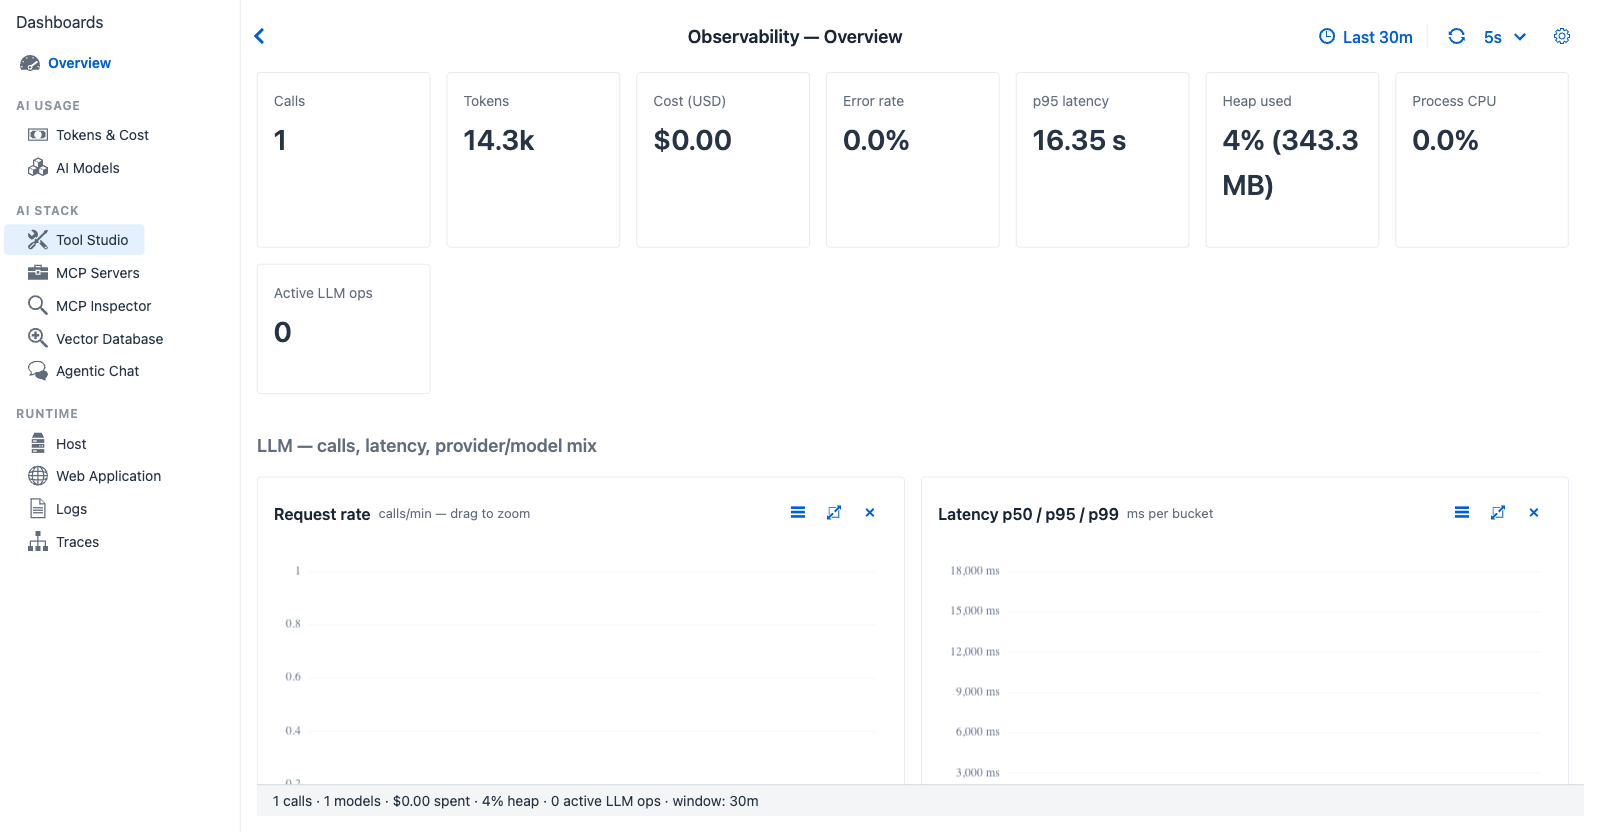
Overview after a brief chat session - one card or chart per concern, with every section linking conceptually to the dedicated tab that owns it. The eight KPI cards at the top stay visible regardless of activity; the charts below fill in as data accumulates.
Route - sidebar → top item → observability?tab=overview
Purpose - single-page summary of every other tab's headline number. Open it first when you don't yet know what you're looking for.
When to look here
- "Has anything changed in the last 30 minutes?" - every KPI has a sparkline showing the trend across the window.
- "Where do I drill in?" - every section header links conceptually to a dedicated tab (Tokens & Cost, MCP Servers, etc.). Spot the anomaly here, then jump.
- "What's the system doing right now?" - heap, CPU, active LLM ops gauges live on this page.
- "Last 10 traces" - the activity grid at the bottom shows the most recent traces; click any row to open Trace Detail.
Controls
All dashboards share the Observability global settings - time window (LAST_5M · LAST_10M · LAST_20M · LAST_30M · LAST_1H · LAST_3H, default LAST_30M), refresh interval, custom From/To range. Sparklines and charts retick to the selected window. Overview adds no tab-specific controls.
KPI cards (eight)
Each headline metric carries a 60-sample sparkline showing the trend:
| Card | Shows | Source |
|---|---|---|
| Calls | Total chat turns in the window | TraceRecord count |
| Tokens | Sum of input + output tokens | TraceRecord.totalTokens (falls back to inputTokens + outputTokens when total is null) |
| Cost (USD) | Total cost across the window | ModelPricingService.cost() × token counts |
| Error rate | Percentage of traces with status=ERROR |
TraceRecord.status |
| p95 latency | 95th-percentile turn duration | ObservabilityTimeSeries.compute().p95LatencyMs |
| Heap used | Current JVM heap utilisation (live gauge) | MeterRegistry jvm.memory.used (heap area) |
| Process CPU | Current process CPU percentage (live gauge) | MeterRegistry process.cpu.usage |
| Active LLM ops | Number of in-flight Spring AI operations | MeterRegistry LongTaskTimer active counts (ChatClient + Advisor + Vector store) |
Charts - six sections, fifteen charts
Each section maps to one dedicated tab.
LLM section → AI Models
| Chart | Type | Reading |
|---|---|---|
| Request rate | Line, calls / min - drag to zoom | Bursts indicate batch workloads or runaway loops |
| Latency p50 / p95 / p99 | Multi-line, ms | p95 - p50 gap widening means tail-latency regression |
| Provider mix | Donut, by call count | Sanity check that the configured provider is actually receiving traffic |
| Top models | Horizontal bar (top 6) | Spot accidental model drift if an unfamiliar model appears |
Tokens & Cost section → Tokens & Cost
| Chart | Type | Reading |
|---|---|---|
| Tokens (input + output) | Stacked bar, 2-series | Disproportionate output → verbose model; disproportionate input → context-stuffing |
Tools / MCP section → Tool Studio · MCP Servers
| Chart | Type | Reading |
|---|---|---|
| Tool calls / minute | Line | Spike → agent in a tool-heavy phase (e.g. multi-step research) |
| Transport mix | Donut - in-process / stdio / Streamable HTTP / SSE | If one transport dominates unexpectedly, the agent is rerouting through it |
| Top tools | Horizontal bar (by call count) | "Which tool is the agent reaching for most" |
| Top MCP servers | Horizontal bar (excludes in-process) | "Which external dependency is busiest" |
Vector / RAG section → Vector Database
| Chart | Type | Reading |
|---|---|---|
| Vector ops / minute | Line - db.vector.client.operation spans |
Drop to zero → RAG offline; sustained high → expensive retrieval |
| top_k distribution | Horizontal bar | Sanity-check the top_k parameter spread; outliers indicate misconfigured agents |
System section → Host
| Chart | Type | Reading |
|---|---|---|
| Heap used (MB) | Rolling line - 60-sample history | Climbing without GC drop → leak suspicion |
| Process CPU (%) | Rolling line - 60-sample history | Sustained high CPU during quiet periods → background work issue |
Logs & outcome section → Logs · Traces
| Chart | Type | Reading |
|---|---|---|
| Logback events by level | Horizontal bar - lifetime totals | Sudden growth in ERROR/WARN → drill into Logs tab |
| Outcome mix | Stacked bar - OK / Error per bucket | Visualises trend rather than absolute level |
Recent activity table
The bottom of the page is a grid of the most recent 10 traces, refreshed in real time from the ring buffer's live stream:
| Column | Source |
|---|---|
| Time | TraceRecord.startEpochMs (HH:mm format) |
| Conv | TraceRecord.conversationId (truncated to 10 chars) |
| Provider | TraceRecord.provider (from gen_ai.system) |
| Model | TraceRecord.model (from gen_ai.response.model or gen_ai.request.model) |
| In / Out | Input and output tokens, slash-separated |
| Duration | TraceRecord.durationMs, human-formatted |
| Status | OK / ERROR / CANCELLED |
Click any row → opens the Trace Detail dialog. This is the fastest path from "something looks off in the overview" to the full span timeline. The same dialog is reachable from the Traces tab.
Cross-references
- AI Usage - Tokens & Cost · AI Models
- AI Stack - Tool Studio · MCP Servers · MCP Inspector · Vector Database · Agentic Chat · Safety
- Runtime - Host · Ollama · Web Application · Logs · Traces
- Tokens & Cost → Model Pricing Manager - configure per-model rates and display currency
- Observability Architecture - pipeline, storage tiers, configuration