Vector Database
Vector Database - Similarity threshold distribution buckets thresholds into 6 bands (0.0-0.1, 0.1-0.3, ..., 0.9-1.0) so an over-strict threshold is visible without per-query inspection.
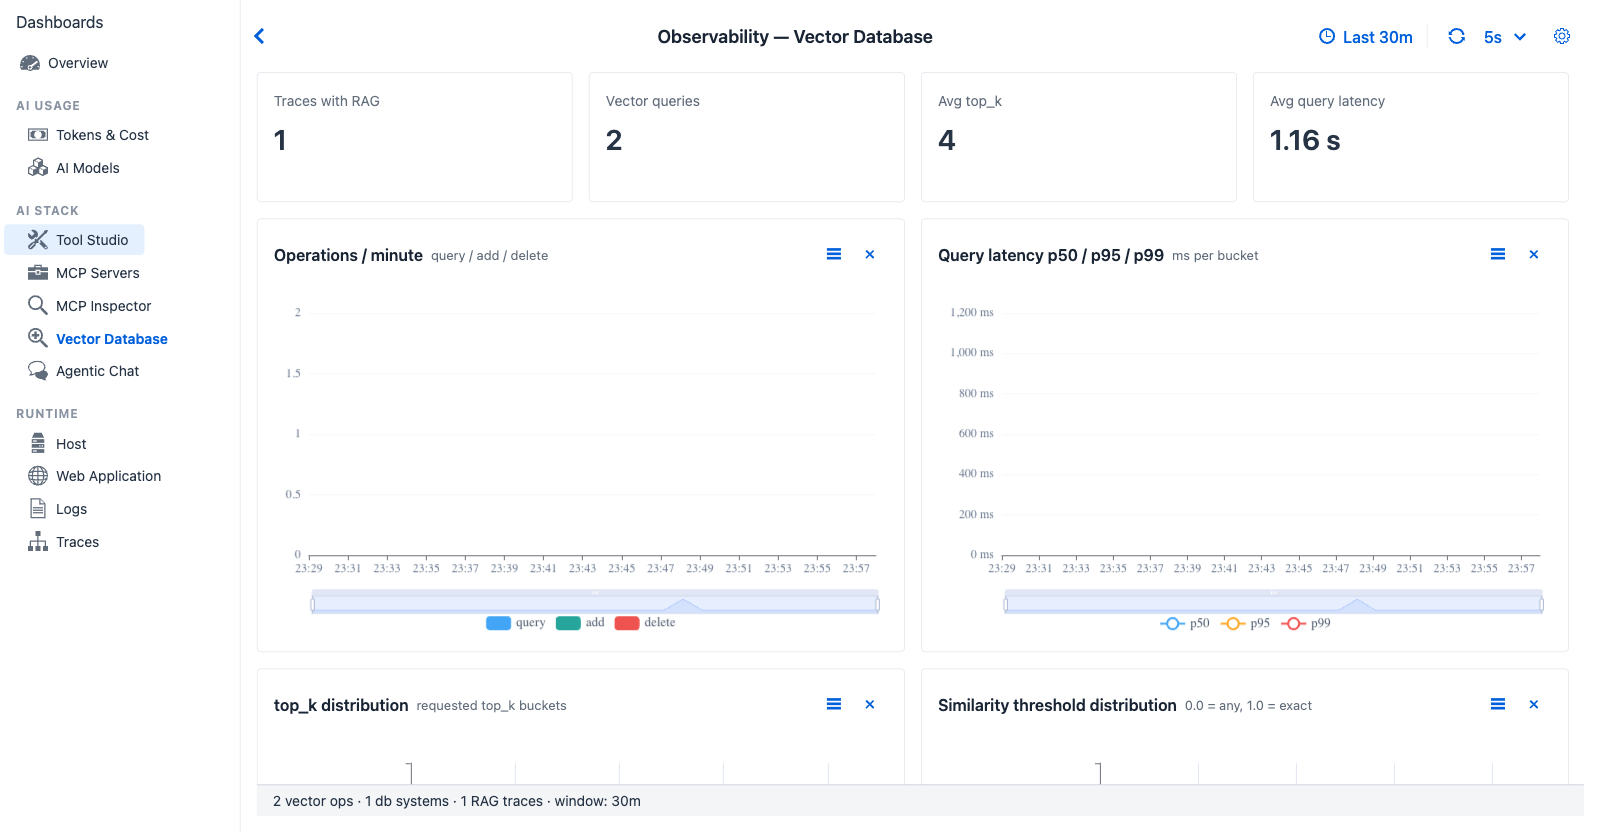
Purpose - RAG-side observability. Beyond simple "did the agent retrieve" questions, this tab surfaces retrieval parameters (top_k, similarity threshold) and per-DB returned-doc counts - the indicators that determine RAG quality.
When to look here
- "Did the agent actually use RAG?" - Traces with RAG count + Vector queries count.
- "Are queries slow against the configured store?" - Query latency p50 / p95 / p99.
- "Is
top_kbeing set sensibly?" - top_k distribution (a spike at 1 or above 50 usually indicates an agent miscalibration). - "Is the similarity threshold too strict?" - Similarity threshold distribution (everything in 0.9-1.0 → almost no recall).
- "Multi-store mix?" - DB systems donut (Chroma / Pinecone / SimpleVectorStore / etc.).
- "How many docs per query, on average?" - Avg returned docs by db.
Span filter
db.vector.client.operation spans.
Controls
All dashboards share the Observability global settings - time window, refresh interval, custom range. Vector Database has no tab-specific controls beyond those.
KPI cards (four)
| Card | Shows | Source |
|---|---|---|
| Traces with RAG | Number of chat turns that included a vector query | TraceRecord.hasRag true count |
| Vector queries | Total vector store operations (query + add + delete) | db.vector.client.operation span count |
| Avg top_k | Mean of the requested top_k parameter |
db.vector.query.top_k attribute averaged |
| Avg query latency | Mean query duration | Span duration |
Charts (six)
| Chart | Type | Reading |
|---|---|---|
| Operations / minute | Stacked bar (query / add / delete) | Add bursts during document ingestion; query bursts during chat |
| Query latency p50 / p95 / p99 | Multi-line, ms | Tail latency on remote vector stores can be ten-fold higher than SimpleVectorStore |
| top_k distribution | Histogram | Distribution of requested k values |
| Similarity threshold distribution | Histogram, 6 bands ([0.0, 0.1) ... [0.9, 1.0]) |
Where the agent is anchoring relevance - strictness vs recall |
| DB systems | Donut by db.system |
One backend = single configuration; multiple = mixed stores |
| Avg returned docs by db | Horizontal bar | Combined with similarity threshold, this is the retrieval-recall signal |
Cross-references
- Vector Database (feature) - how documents are ingested and indexed
- Tutorial 3 - Index a Document - end-to-end ingestion walkthrough
- Tutorial 5 - Chat with RAG - consuming the indexed corpus