Safety
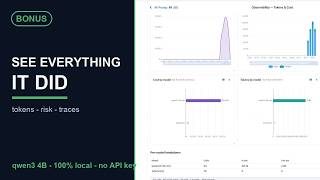

Purpose - the security view across the MCP risk model and the JS tool sandbox. It rolls up every safety signal the runtime emits - per-call risk levels, tool-description poisoning scans, content-hash tamper detection, human-in-the-loop approvals, and sandbox guard rejections - into one dashboard, so an operator can answer "is the agent being fed anything dangerous, and did the guards catch it?" at a glance.
When to look here
- "How risky is the tool surface the agent can reach?" - Risk level distribution (L0-L5).
- "Did an upstream tool quietly change its definition?" - Tamper rejects KPI (content-hash ledger, TOFU).
- "Is any tool description trying to inject instructions?" - Poisoning hits KPI + the risk-event timeline.
- "Are humans actually approving the gated calls?" - HITL approval rate.
- "Is the sandbox blocking unsafe actions?" - Sandbox guard blocks (SSRF / filesystem policy).
Data source
Three sources, all lifetime (not windowed):
- Counters via
SystemMetricsSnapshot-saip.risk.signal(grouped by signal type),saip.tool.risk(grouped by composed levelL0-L5),mcp.hitl.decision(grouped by outcome), andsandbox.guard.blocked(grouped by reason). Thesaip.*counters are emitted byMcpRiskSignalLogger(the risk-signal sink) andMcpToolObservationFilter. - Event timeline via
McpRiskEventRingBuffer- the most recent risk events (server/tool risk computed, floor override, hash mismatch, composition lifecycle, poisoning hit) with their type and summary. - Management audit log via
ManagementAuditLog- the in-memory trail ofsaip_*calls behind the Management tool calls list.
See MCP Server Safety for the risk model these signals come from.
Controls
Shares the Observability global settings, but the KPI cards and bar charts are lifetime counters - the time-window preset does not scope them. Only the Recent risk events timeline reflects recency (most recent 50).
KPI cards (six)
| Card | Shows | Source |
|---|---|---|
| Risk signals | Σ all saip.risk.signal events (lifetime) |
saip.risk.signal counter |
| Tamper rejects | hash-ledger-mismatch - a default/exposed tool's content hash changed since first seen (TOFU) |
saip.risk.signal{type=hash-ledger-mismatch} |
| Poisoning hits | poisoning-hit - a tool description/schema matched a prompt-injection pattern |
saip.risk.signal{type=poisoning-hit} |
| Floor overrides | floor-override-triggered - a risk floor rule forced a higher level |
saip.risk.signal{type=floor-override-triggered} |
| HITL approval rate | % approved of all human-in-the-loop decisions | mcp.hitl.decision counter |
| Sandbox guard blocks | Σ sandbox.guard.blocked (SSRF + filesystem policy rejections) |
sandbox.guard.blocked counter |
Charts (four)
| Chart | Type | Reading |
|---|---|---|
| Risk signals by type | Horizontal bar | saip.risk.signal grouped by type - server-risk-computed, tool-publish-risk-computed, floor-override-triggered, hash-ledger-mismatch, hash-ledger-recanonicalized, composition-lifecycle, poisoning-hit |
| Risk level distribution | Horizontal bar, L0→L5 in order | Final composed risk level of each executed MCP tool call (saip.tool.risk). L0 verified · L1 safe · L2 low · L3 moderate · L4 high · L5 critical |
| HITL decisions | Horizontal bar | mcp.hitl.decision outcomes from both gates: approved / declined / timeout from either, plus ask-failed (side=chat) and denied / elicit-failed (side=server). The approval questions of the management tools (publish, exposure change, register, run) count on the server side like any elicitation |
| Sandbox guard blocks | Horizontal bar | sandbox.guard.blocked by reason: host-not-in-allowlist, private-ip, too-many-redirects, body-too-large, ... |
Tables
Recent risk events - a scrollable timeline of the latest events from McpRiskEventRingBuffer, each row showing time, a type badge (warn-tinted for failures), and a one-line summary. Populated as MCP servers and tools are registered, exposed, composed, or fail an integrity/poisoning check. A MANAGEMENT event marks every management tool call that changes something (write or destructive level, such as saip_tools_publish, saip_expose_add_tools, saip_mcp_add_from_catalog, saip_shipyard_run) and every call that did not end OK. Destructive or failed calls are warn-tinted. Each row shows the client that made the call and its outcome, so the trail an AI leaves sits next to the risk signals its actions raised.
Management tool calls - the audit trail of the saip_* management tools: every call with its approval level (read / write / destructive), outcome (OK, ERROR, REFUSED, DECLINED, DENIED, TIMEOUT), the client name and version, and the duration. The line above the list states whether the management tools are on, how many are offered, which categories and the approval mode, all from configuration. saip_monitor_management_log returns the same rows to the AI, which is how an AI's own report and this dashboard end up describing the same facts (Tutorial 19, section 7). The app keeps the last spring.ai.playground.management.audit-capacity calls (500 by default) and the list shows the newest 50. The log starts empty when the app starts.
Cross-references
- MCP Server Safety - the L0-L5 risk model, content-hash ledger, and poisoning scanner this dashboard surfaces
- Safety Architecture - the JS sandbox layers behind the
Sandbox guard blockscounter - Human-in-the-Loop - the approval gate behind the
mcp.hitl.decisioncounter - Management Tools - the
saip_*tools behind the Management tool calls list and theMANAGEMENTrisk events; AI Operations Architecture explains how the audit trail is written - Tool Studio - sibling AI Stack tab for in-process tool execution
- Observability Architecture - the counter / metrics pipeline