Ollama
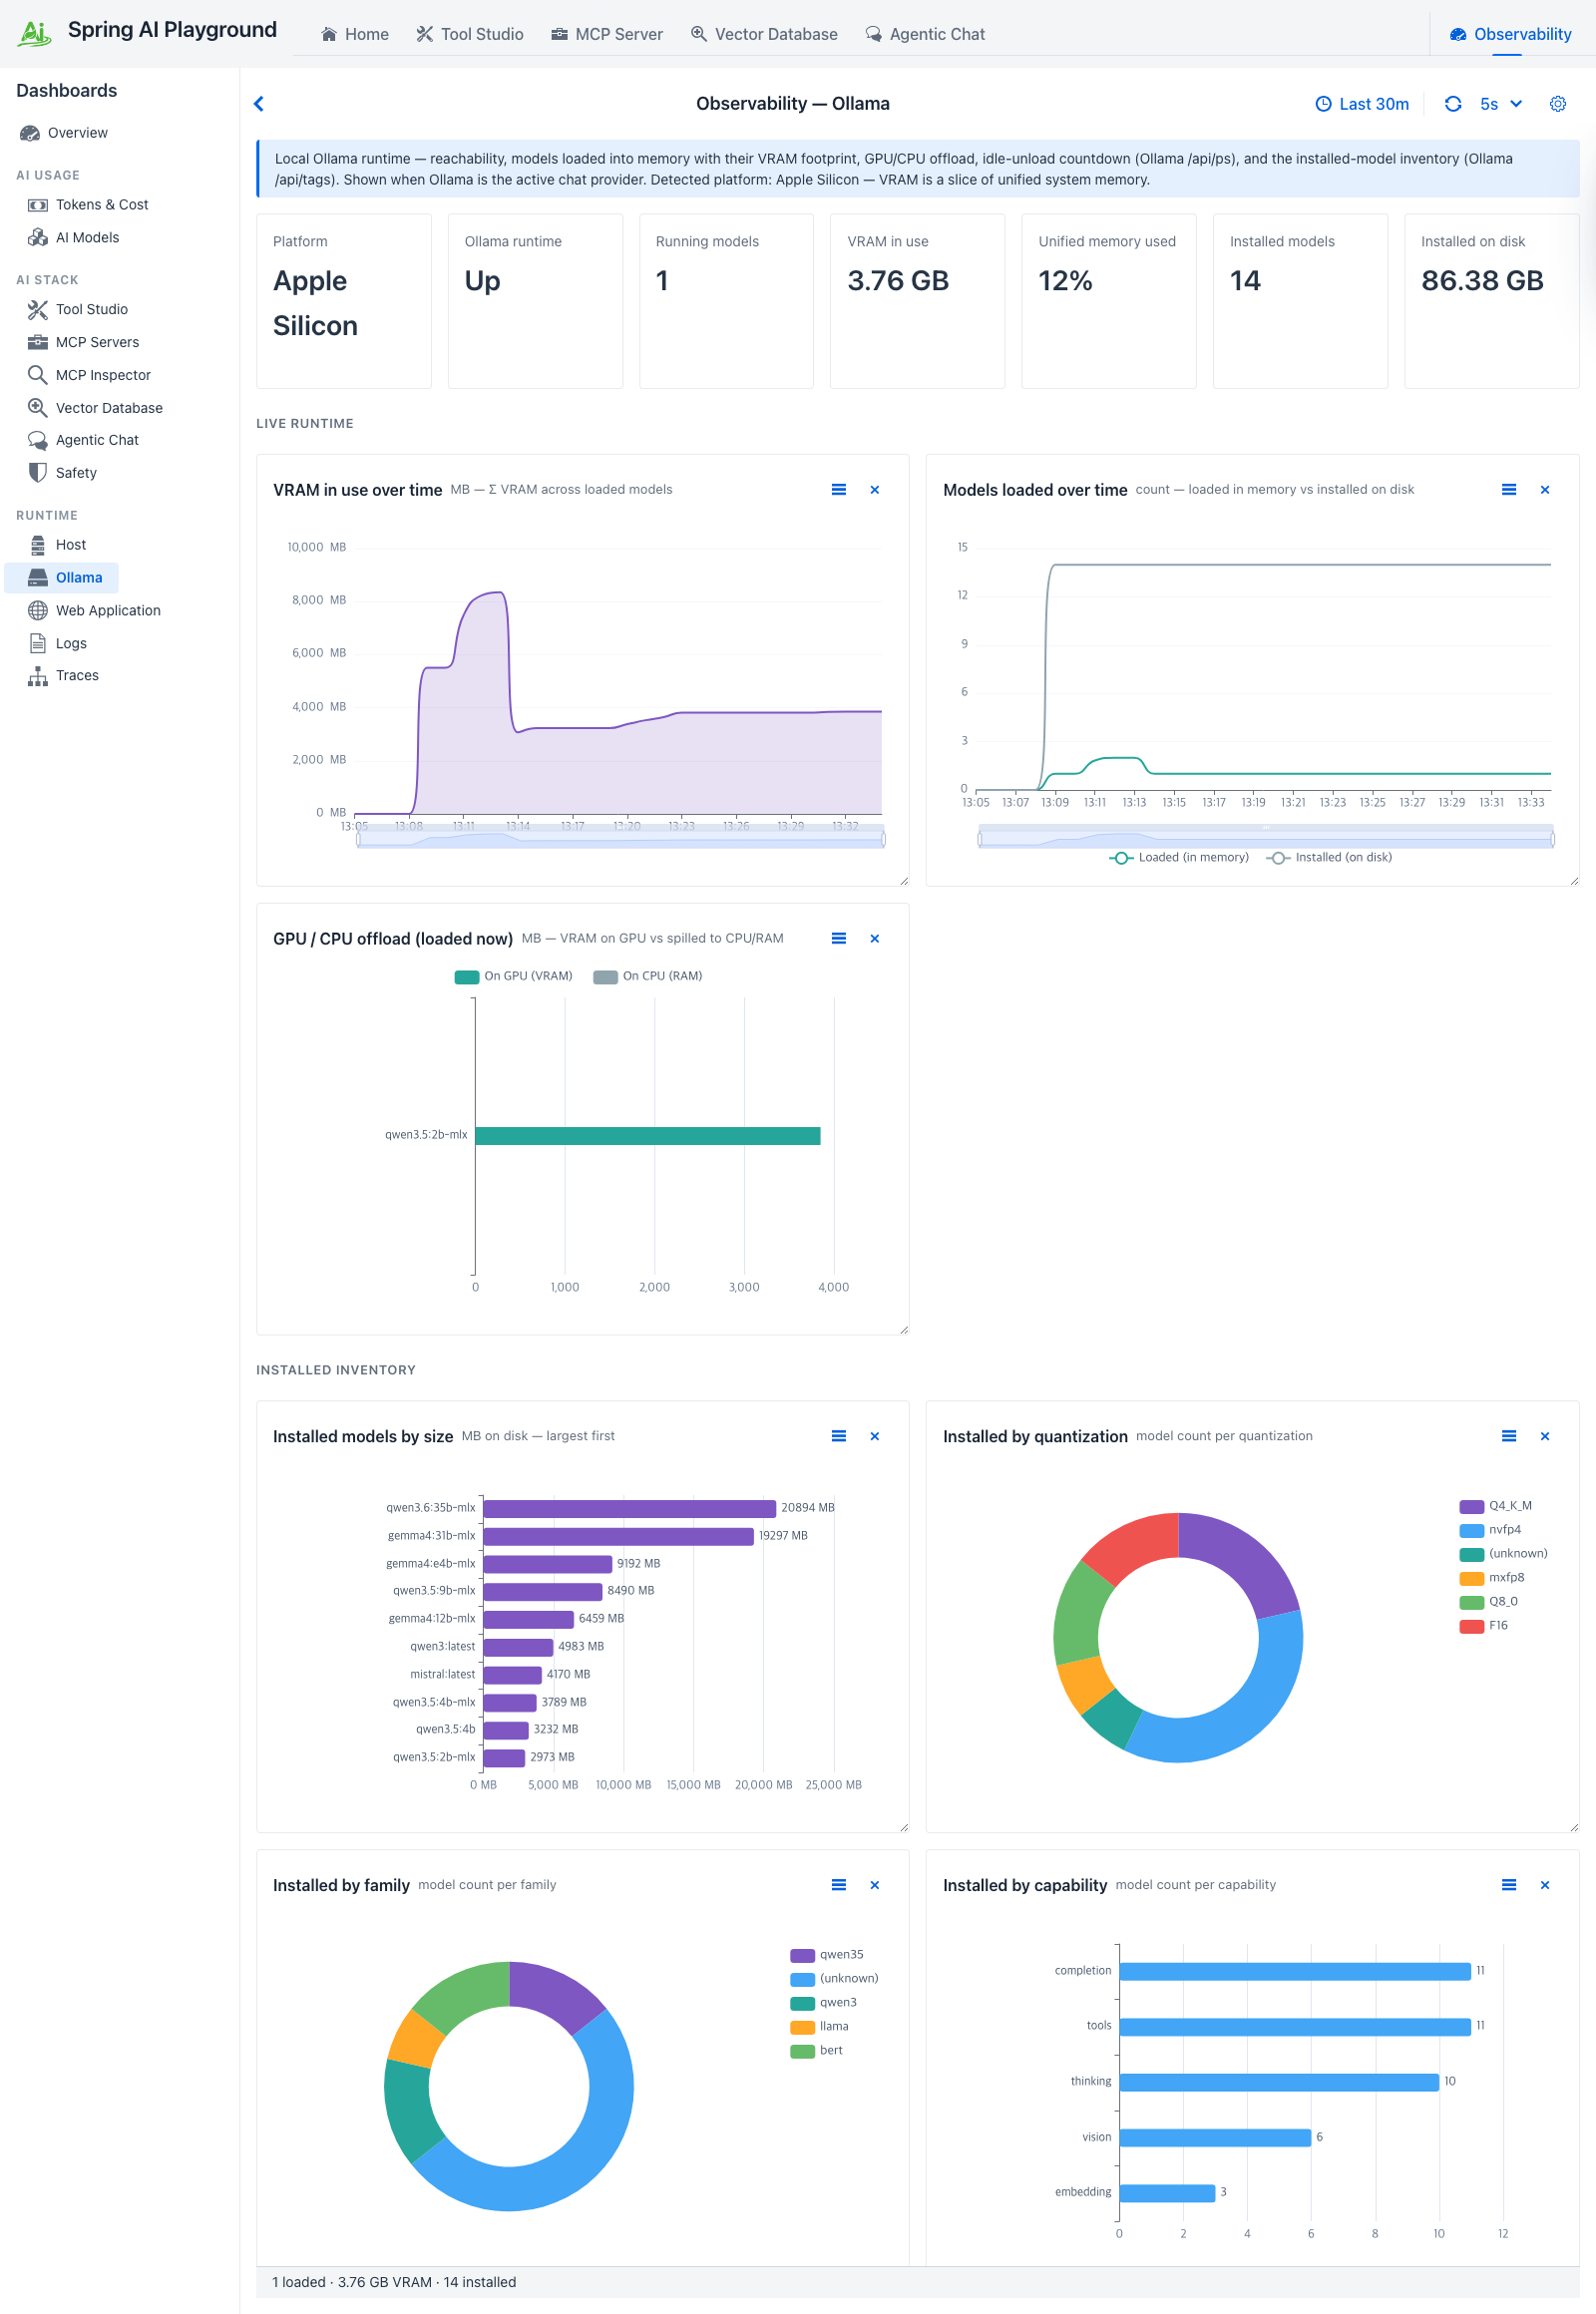
Ollama tab on Apple Silicon while qwen3.5:2b-mlx is loaded - live state comes from Ollama's /api/ps and /api/tags, and the trend charts from a scheduled sampler. The memory card adapts to the platform: a percentage of unified system memory here, an absolute VRAM figure on a discrete GPU.
Purpose - local Ollama runtime: is a model resident, does it fit in VRAM or spill to CPU, how much memory is in use, and what is installed locally. Shown only when Ollama is the active chat provider.
When to look here
- "Did the model fit in VRAM or spill to CPU?" - GPU / CPU offload (any CPU/RAM portion means it did not fully fit → slower inference).
- "How much memory is Ollama using right now?" - VRAM in use + Unified memory used (warns at 85% on unified-memory hosts).
- "What is loaded and when will it unload?" - Running models KPI + the loaded-models list with its idle-unload countdown.
- "What models do I have, and which are the disk hogs?" - Installed models by size + Installed on disk.
- "Which models can do tools / vision / thinking / embedding?" - Installed by capability.
- "What quantization or family mix is installed?" - Installed by quantization / Installed by family.
- "Am I on Apple Silicon (unified memory) or a discrete GPU?" - Platform KPI.
- "Has Ollama been up, or flapping?" - Reachability over time (% of samples the server responded).
Data source
OllamaMonitorService (active only when ChatProvider is OLLAMA) calls Ollama directly over HTTP: /api/version for reachability, /api/ps for running models + VRAM, /api/tags for the installed inventory and its details (parameter size, quantization, family, context length, capabilities). OllamaMetricsCollector samples that on a scheduled cadence into OllamaMetricsRingBuffer, and OllamaMetricsTimeSeries derives the trend charts. The Unified-memory percentage compares loaded VRAM against host physical memory from SystemMetricsSnapshot. None of this flows through the trace pipeline.
Controls
Ollama reads the Observability global refresh interval; the trend charts honour the time window, while the live KPIs and the loaded-models list are always current. Platform is auto-detected from os.name / os.arch and can be forced with spring.ai.playground.observability.ollama.platform (auto | apple-silicon | linux | windows | mac-intel) for misdetection or screenshots. When Ollama is not the active provider the tab shows an inactive empty-state.
KPI cards (seven)
| Card | Shows | Source |
|---|---|---|
| Platform | Detected OS + accelerator (Apple Silicon · Metal / unified memory, or Linux / Windows · discrete GPU) | os.name + os.arch (override property) |
| Ollama runtime | Up / Unreachable / Inactive, plus server version | Ollama /api/version |
| Running models | Models currently loaded into memory | Ollama /api/ps |
| VRAM in use | Σ size_vram across loaded models |
Ollama /api/ps |
| Unified memory used / VRAM loaded | OS-aware: % of host unified memory on Apple Silicon (warns at 85%); absolute VRAM loaded on a discrete GPU (Ollama does not report total VRAM capacity) | /api/ps + host physical memory |
| Installed models | Count of models pulled locally | Ollama /api/tags |
| Installed on disk | Σ disk footprint across installed models | Ollama /api/tags |
Charts (eight)
| Chart | Type | Reading |
|---|---|---|
| Reachability over time | Rolling line (%) | % of samples where the Ollama server answered /api/version while it was the active provider; dips mark outages or restarts |
| VRAM in use over time | Rolling area line (MB) | Ramps as a model loads, drops on idle-unload; flat-high = a model pinned in memory |
| Models loaded over time | Multi-line (loaded vs installed) | Loaded rises on first use and falls on idle-unload; installed is the on-disk ceiling |
| GPU / CPU offload (now) | Horizontal stacked bar per loaded model | size_vram on GPU vs size - size_vram on CPU/RAM - any CPU portion means the model did not fully fit in VRAM |
| Installed models by size | Horizontal bar (top 10, MB) | Largest disk consumers first |
| Installed by quantization | Donut | Q4_K_M / Q8_0 / F16 / MLX nvfp4 / mxfp8 mix; MLX builds report MLX quant levels |
| Installed by family | Donut | qwen / llama / bert / ... ; MLX builds may not report a family ("(unknown)") |
| Installed by capability | Horizontal bar | completion / tools / thinking / vision / embedding counts across installed models |
Cross-references
- Host - sibling runtime tab for JVM/OS health; the Unified-memory percentage reuses its host physical-memory reading
- AI Models - provider, model routing, and token economics for chat traffic (Ollama appears there as the provider)
- Tokens & Cost - why local Ollama traffic shows a
$0cost