Logs
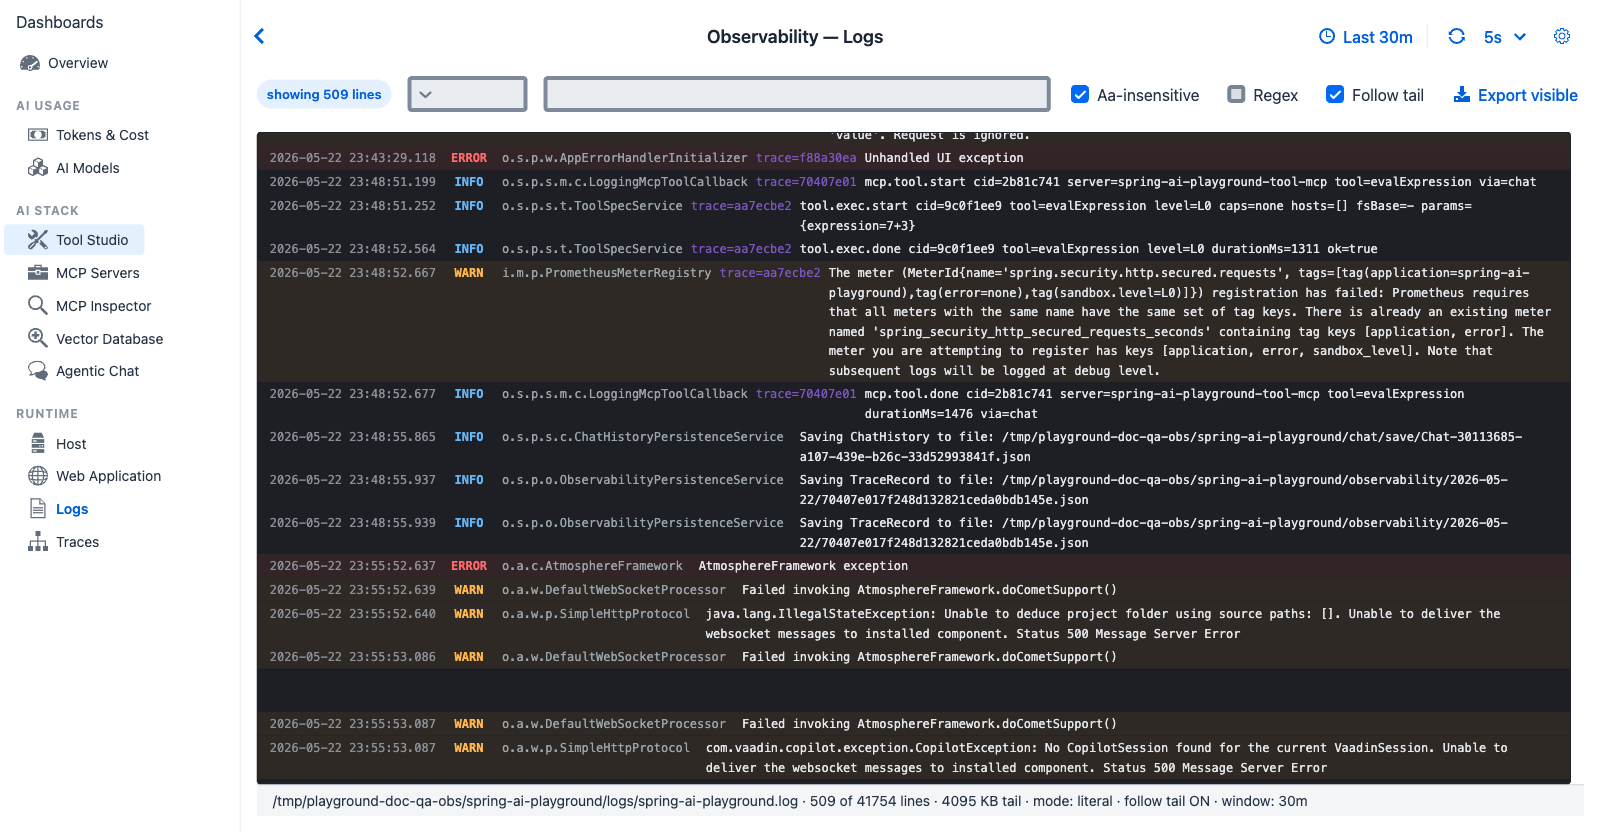
Logs tab - each line carries the MDC keys injected by the Logback pattern (user, sid, conv, msg, traceId, spanId), forming the bridge between log search and trace drill-down.
Purpose - live log search with structured MDC extraction. The Logback pattern injects user, sid, conv, msg, traceId, spanId MDC keys into every line emitted during a chat turn, so a log line is always anchored to the trace it came from.
When to look here
- "Something errored - give me the actual stack trace" - Level filter
ERROR+ text search. - "Which lines belong to trace
0e9b1a980c1d?" - Text search the trace ID. - "Show only Spring AI subsystem output" - Text search
spring.ai.or filter by logger pattern. - "I want to see the full pattern of one conversation" - Search the conversation ID.
Data source
Live tail of the application's rolling log (the same stream the file appender writes). Up to 4 MB of recent lines is loaded; older lines are off-screen.
Controls
- Level dropdown -
ALL,ERROR,WARN,INFO,DEBUG,TRACE - Session dropdown - filter to one session (options populated from the visible lines)
- Contains / Regex text field - substring or regex match
- Aa-insensitive checkbox - case insensitivity toggle
- Regex checkbox - interpret the filter as regex
- Follow tail checkbox - auto-scroll to newest line on each refresh (disabled when custom time range set)
- Export visible button - download the filtered visible lines as
.log - Time-window preset (see Observability global settings) plus a custom From / To range in the settings drawer (custom range disables auto-refresh + follow-tail)
Log line structure
The Logback pattern emits each line with this shape:
2026-05-22 00:21:01.618 [reactor-http-...] INFO o.s.p.s.chat.ChatService [user= sid= conv=Chat-6af5b06e msg=4f37... traceId=0e9b1a980c1d spanId=d23f...] - generated user message id 4f37...
The Logs tab parses each line into: time · level · logger · user · session · conv · msg · traceId · spanId · message. Row colour:
- ERROR rows - red tint
- WARN rows - orange tint
- All others - dark-theme console row (background
#1e1f24)
Drilldown - Log line dialog
Double-click any row to open the Log line dialog - single-click leaves the text selectable, so you can drag across lines to copy them without a dialog interrupting. The header shows the line's level and timestamp; the body lists the MDC fields parsed from the line - Logger, User, Session, Conv, UserMessageId, TraceId, SpanId (each rendered as - when the line did not carry that key) - followed by the full raw line in a scrollable block.
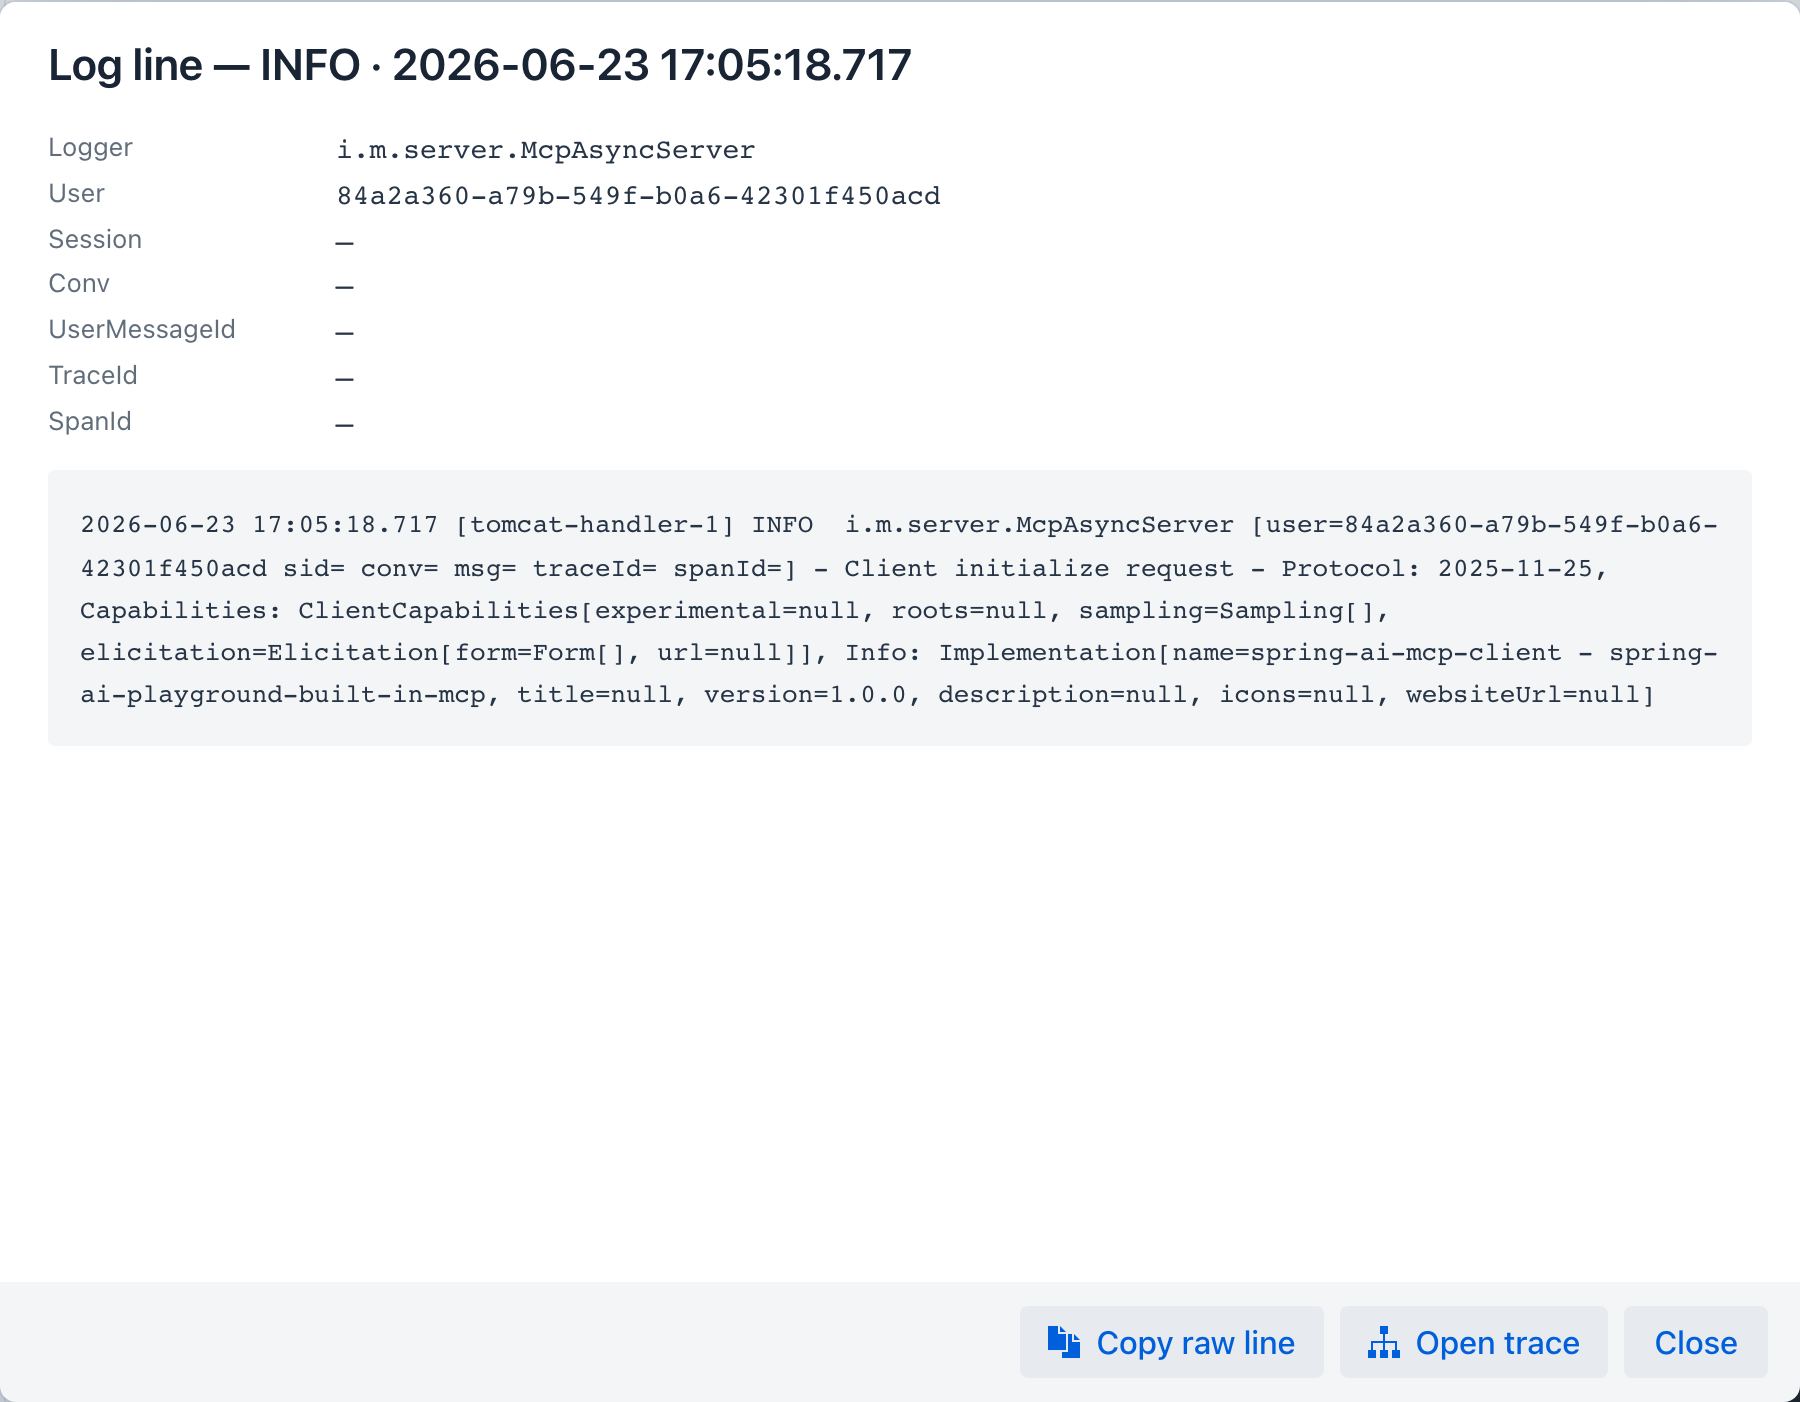
The footer carries these actions:
- Copy raw line - copies the unparsed line to the clipboard.
- Open trace - navigates to the Traces tab filtered by this line's
traceId, the bridge from a single log line to the full span tree of the request that produced it. If the line has notraceId, it reports that instead. - Open in chat - shown when the line carries a
conv; opens that conversation thread. - Close - dismisses the dialog.
Cross-references
- Traces - drill from log row → trace by
traceId - Observability Architecture → Log correlation - Logback pattern reference